
Meadow Analytics with Premium Inventory Velocity and Insights is part of our all-in-one cannabis retail software designed to help dispensaries turn their data into bigger margins and more revenue. These tools give retailers powerful insight about inventory, sales, revenue and customers, with at-a-glance analytics on any device. They help buyers forecast inventory demand with precision, maximize inventory and shelf space, see any product performance in an instant and identify which products need to move with discounts and promos.
At Meadow, we have always offered deep reporting functionality with more than 20 exportable reports. For the people who prefer to see data in dashboards rather than Excel, we've developed these amazing new tools for cannabis retail operations and management to turn data into actionable insights and revenue. We think of these tools as an infrastructure investment. These newly released tools are a major upgrade that allows dispensaries to move faster and smarter, reduce waste and become more efficient with time and effort, inventory and therefore your money. No need to download spreadsheets—everything is right in front of you in an instant, giving you the information you need to make fast, effective, data-driven decisions.

We made upgrades to servers to quickly show this depth and amount of data to take every single order and every customer and every line item that's ever been run through your system and to make it that responsive at that speed. The computing power required for the amount of data we’re crunching is more expensive. It’s worth remembering: A rocket ship costs more than a bicycle, but you can only use one to get to the stars. So that's what we've built: Tools that are going to take your dispensary further and faster.
PREMIUM ANALYTICS
With our premium analytics tool, you can select the data points: maybe you want to be able to compare month by month instead of week by week. You could also come in then and say, okay, well, show me the last 12 months on a monthly basis. Looking at the last 12 months, you can easily see your total sales, the total orders and the average per increment. So if you were to select weeks, then it's going to give you the average sales per week for that increment, whereas if you select months, it will show the month by month average over that period. You can also see things like average cart size, and can compare average cart size in store orders versus delivery orders versus pickup orders, and then overall.
USING DATA TO TRACK CANNABIS RETAIL TRENDS
These tools make it easy to see the different trend lines of your business. You can say specifically what dates you want to look at to see changes over time. Look over the last 30 days on a daily basis to see, everyday activity for the last 30 days. Maybe you just want to compare a few days, say March 16th through 18th, and you'll see that the increment updates automatically for those three days. You can view those three days to see exactly what was happening; you can keep adjusting different dates, from two days all the way up to four years. As you adjust the dates, the tool will quickly calculate the data points.
SEE WHERE ORDERS ARE COMING FROM
Say you want to compare how delivery and pickup are doing over time. You can see the amount of your average pickup order over the last month has been. And you can see the plot points and zoom in — perhaps you had a peak day in early July; maybe due to the 7/10 holiday. And I bet you would see an uptick in shatter, waxes and oil in that week, knowing that July 10th is a day to celebrate cannabis concentrates.
But maybe the data point that shows an uptick in delivery sales was not an easy to identify holiday—in this case, it’s worth reviewing: What was it that you were doing differently? Was there some incentive where you were giving promos on the website? Similarly then you could also look at pick-up orders to see how those numbers looked that week to compare average cart sizes based off of the order type. And underneath that data, you’re able to see the percent of revenue from each of these order sources.
Say that you’re getting about 54% of your revenue and the dollar value over this period from your delivery order source. You can also look at it as a percentage of sales. So of course this adds to 100 because you sold a given amount of product and it will show you what percent of your sales were coming from each of these different sales channels. Maybe you see that in June over half of your orders were via delivery, and then in July that went down significantly. You're able to clearly see howall of that information changes over time in terms of percent of my revenue from each source and the percent of orders, the volume versus the value.
It's pretty common that we'll see the delivery and pickup will have a higher average value than in store orders, but usually in store we'll have a higher volume.
Maybe you just want to compare to see which of your payment types is giving the largest average cart size. And it's not uncommon to find that people who are paying with debit or some other card will spend a higher amount, on average.
You’ll also be able to see that wow, for a large number of my orders, my staff is marking them as fulfilled without actually recording the payment type. This is helpful data to show you where more training is needed with your budtenders by emphasizing the importance of recording a payment type when fulfilling orders at the register. It’s helpful to be able to see data and trends change over time and compare what is happening with your sales over time.
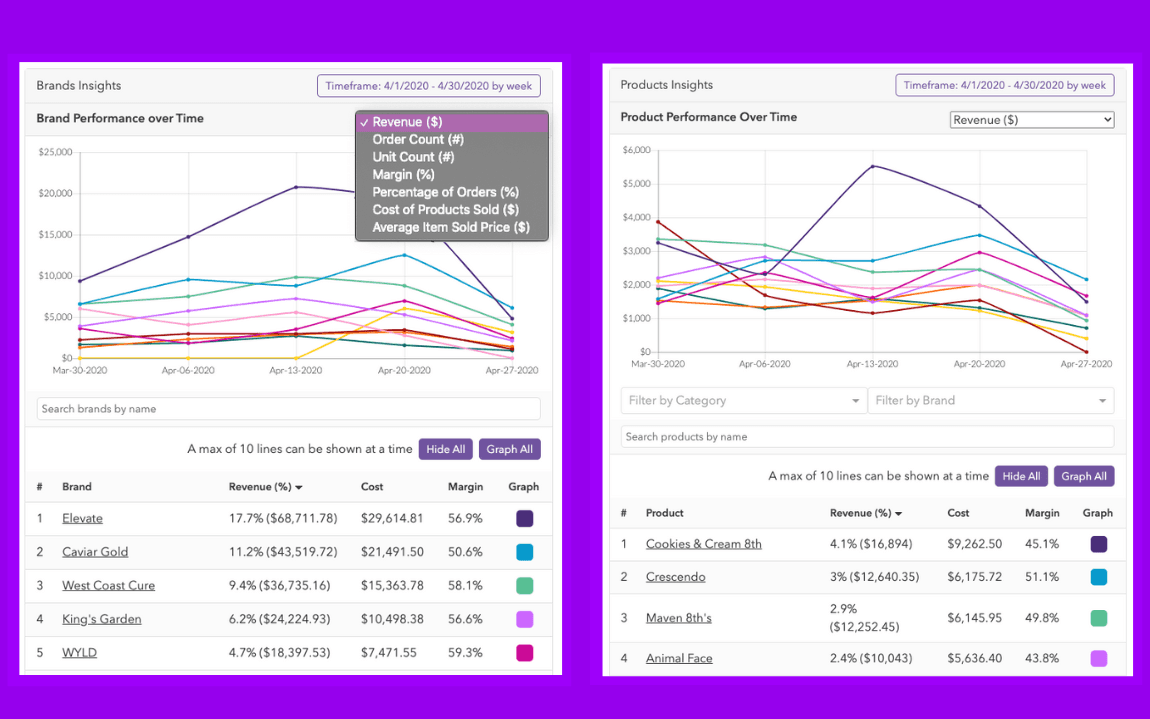
REVIEW PRODUCT PERFORMANCE
What products are moving? Want an idea of how your products are doing in a specific timeframe, relative to one another? At a glance, you can see your top five categories, with the percent of revenue from each category, the total dollar revenue, as well as the cost and the margin.
You can also review the break down from brands as well as products.
What if I want to drill down a little bit more beyond the nice top level overview. Again, you can choose the time period; maybe you want to go from 12 months to go back even further. Let's go all the way back to 2018, the good old days.
This tool will quickly recalculate everything; it's extremely fast. Click in to any of these areas, categories, brands, or products to see your category performance over time.
Maybe you want to see the change in flower or vape sales over time. And maybe you would see some impact from the vape crisis and then an uptick when everyone forgot about it, or you can compare two or three specific things (ie. which of your beverage brands are performing best?).
You can create a graph to see the number of orders that included flower 6 months ago, and how that compares to what’s moving now. Maybe a year ago, your customers were more likely to purchase pre-rolls because they didn't know how to roll a joint. Perhaps the data will show that you’re getting less orders for flower now, but the people who order it are ordering a larger amount; maybe revenue has actually gone up over time, showing you have some really heady customers whose average order size is increasing. This is a great datapoint to surface—how can you ensure those top selling customers remain loyal to your business? (Hint: Now’s also the time to ensure your loyalty program is set up to properly reward these VIP dispensary customers).
COMPARING PERFORMANCE OF PRODUCT TYPES
If you have a product that has two or three size options, you can view the performance at the level of the product itself. For example, say you have Heavy Hitters cartridges in both a half gram and a one gram cart, you can actually apply multiple filters at once to graph whatever products and timeframes you want to view to see which size is more popular.
You can see the orders and how many people have ordered those product types, as well as the units purchased for each of those increments (i.e. by month or for the last 12 months) and you can see how your margin changes over time as well as the cost of the product sold.
Filter by brands and by categories at the same time you can search; maybe you want to see what happened after you started stocking Red Congo; you can compare by brand and graph the subset of Gold Seal products as well as the order count for that strain.
You can drill down a little bit further to the product options level to see different product sizes. So maybe you sell Durban Poison by the eighth or by the gram; you can quickly see that the eighth is the more popular option over the last two months; you can increase or decrease the increment and get more granular to look at the last six months. Drill into what are my highest costs? These are my highest cost products, and you can look at my cost of product sold and how it's changed over time. It's highly customizable. It’s easy to quickly see exactly what it is you want to see and then down to brands level to understand what brands and products are most popular with the customers and working the hardest for you in terms of margin.
At a glance, you can review:
- brand performance
- product performance
- revenue basis
- volume basis
DO YOU KNOW WHO ARE YOUR CUSTOMERS & WHERE THEY ARE COMING FROM?
How many returning customers vs anonymous orders are in your system? Several dispensaries just allow customers to come in and show an ID at check-in to prove they are of age, and that dispensary will process an order without tying it to a customer profile in their CRM. If the data shows you had a spike in anonymous orders recently, maybe you want to train and reward your front desk for ensuring they’re proactively getting signed up in your system for your loyalty program and the great marketing promos that you're going to send them.
In Meadow, when viewing a customer's profile or creating an Order in Admin, you will now see a "1st Time Customer" badge for any customer with no fulfilled orders; this is designed to alert your staff that this customer could use a warm welcome and more of a tour of your offerings and products than a regular customer might.
The more data you collect, the more you can better understand who is shopping with you, how they discovered you, and how to lead them to products you think they’ll like. You can track referral sources to see what marketing channels are working and average cart size based on the referral source.
Perhaps over time you can see a shift in how many people are coming from Weedmaps. Maybe the data shows that people who found you on Google are big spenders. In that case, you may want to adjust your marketing strategy to focus on boosting your SEO by figuring out ways to drive quality links to your website menu.
You can be very specific to see how the data changes over time. Maybe you pay for a billboard for just a few months and you wanted to see what kind of payback you're getting off of that. You can see order account as well as the order volume as a percentage of your sales. If the data shows “wow, 18% of my sales over this year heard about me from a billboard,” that initial investment in the ad space might prove to be a pretty good method that’s worth repeating (though, of course now in California, you can't put anyone put a billboard anywhere near a road that crosses the border, which is pretty ludicrous because that counts most of the roads with billboards).
PREMIUM INVENTORY VELOCITY & INSIGHTS
Meadow's inventory forecasting tool will show you at-a-glance how fast or slow products are moving so you always know your best and worst performers, how many days of inventory you have on hand, and when to re-order.
Using Inventory Velocity you can see which products are selling best, which are sitting on the shelf, and when you should re-order (or not). Velocity is a tool that's really helpful for your buyers and for your purchasers.
What questions can I answer with velocity?
At the heart of it, velocity is about having the right products in the right quantities in your inventory. We start with two basic questions and build from there:
How many units of a product do you sell on an average day? That's its velocity.
Once you know that, you can track inventory to make sure you have the right quantity of each product on hand: too little and you'll run out; too much means money sitting on the shelf.
What's the cost and revenue for every product in your inventory or on order?
Knowing product velocity on a cost and revenue basis helps smooth your budgeting and cash flow, all while keeping the right mix of inventory on-hand and on-order.
Customize the data points to review a whole month or quarter or even an entire year to track seasonal changes and see the number of units sold in that period by the number of days.
Using this information, you can make strategic decisions and figure out:
- What products are selling the most/least per day (in a given time period)?
- What products make up the most/least of my daily COGS and revenue?
- How many days of inventory do I have left (at current sales velocity)?
- When should I re-order products to avoid out of stock events? What should I re-order ASAP? What am I running out of?
- What do I have too much of or should not restock? What products need discounting or promotions to sell through?
- How many units of each product are on open Purchase Orders to be received?
- What is the cost basis and expected revenue for products in inventory and on open POs?
You can see how quickly products are moving, and you can easily set up your sales window with a PO lead time and a buffer time to make sure that you have enough time to place orders in advance and restock products before you run out.
Maybe your velocity on an average day for the Cereal Milk strain is 16.7 units. The tool will show you that you have 501 units currently in inventory, with another 50 on an outstanding purchase order. You can easily see how many days of inventory you have on hand to help you know the exact day to reorder based on the rate at which you sell it.
At a glance you’ll also be able to see places where you have product glut; maybe you have 988 units of a product that you’re not selling very much of it. Perhaps you see that you’ve got an estimated 14,000 days of inventory and you’re not going to need to reorder for a few decades. However, because cannabis goods have shorter expiration dates, you can quickly see that you want to put this product on sale at a deep discount to recoup some of the expense you spent to purchase it all.

In addition to seeing the amount of inventory and how many days until you want to re-order, you can also view your dollar cost or your potential revenue. Maybe you want to see what inventory you have on hand by cost to quickly review what's the most expensive product in your inventory right now as a whole. Maybe you see that you’ve got over $18,000 worth of Alien OG sitting in your inventory.
You can also see your potential revenue or your inventory, looking at the number of units that you have in your inventory or on your purchase orders and multiply it by your current line price.
Maybe you just want to see flower that's low stock; you can easily look at your quantity. If you’ve only got 20 in inventory and you sell a 3.3 a day, you know you’re going to run out in like six days.
It’s easy to know what to reorder by reviewing your low stock products to know what's selling out soon and what you should reorder based off of your purchase order lead time.
STRATEGIC DISCOUNTS
When you look at your inventory velocity, you may see that you have product sitting on the shelf that's been there a long time. If you have a surplus of products, especially products nearing their expiration, it's time to GET. THEM. MOVING.
Set up a discount and promote to customers who have purchased that product, similar SKUs, or within that product category before.

